
Strategic Problem Solving Consulting
Helps you carry out your project through a logical thinking process
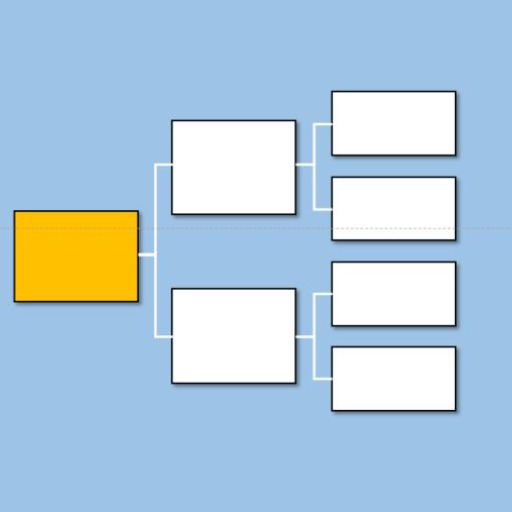
To systematically categorize and organize key considerations for making a decision or solving a problem using a logic tree table format
これらの数値は保存されたカタログ記録から取得されたものであり、ライブの使用統計ではありません。
Considerations when establishing business strategy
What causes this problem?
Create a logic tree on how to increase the company's profits based on financial formulas
What should you consider when purchasing a car?
この GPT は添付ファイルをサポートしています。
| 録音日 | 会話 |
|---|---|
| 1,000 | |
| 1,000 | |
| 1,000 | |
| 1,000 | |
| 1,000 | |
| 1,000 | |
| 1,000 | |
| 1,000 | |
| 1,000 | |
| 1,000 | |
| 1,000 | |
| 1,000 | |
| 1,000 | |
| 1,000 | |
| 1,000 | |
| 1,000 | |
| 1,000 | |
| 1,000 | |
| 1,000 | |
| 1,000 | |
| 1,000 | |
| 1,000 | |
| 1,000 | |
| 1,000 | |
| 1,000 | |
| 1,000 | |
| 1,000 | |
| 1,000 | |
| 1,000 | |
| 1,000 | |
| 1,000 | |
| 1,000 | |
| 1,000 | |
| 1,000 | |
| 1,000 | |
| 1,000 | |
| 1,000 | |
| 1,000 | |
| 1,000 | |
| 1,000 | |
| 1,000 | |
| 1,000 | |
| 1,000 | |
| 1,000 | |
| 1,000 | |
| 1,000 | |
| 1,000 | |
| 1,000 | |
| 1,000 | |
| 1,000 | |
| 1,000 | |
| 1,000 | |
| 1,000 | |
| 1,000 | |
| 1,000 | |
| 1,000 | |
| 1,000 | |
| 1,000 | |
| 1,000 | |
| 1,000 | |
| 1,000 | |
| 1,000 | |
| 1,000 | |
| 1,000 | |
| 1,000 | |
| 1,000 | |
| 1,000 | |
| 1,000 | |
| 1,000 | |
| 1,000 | |
| 1,000 | |
| 1,000 | |
| 1,000 | |
| 1,000 | |
| 1,000 | |
| 1,000 | |
| 1,000 | |
| 1,000 | |
| 1,000 | |
| 1,000 | |
| 1,000 | |
| 1,000 | |
| 1,000 | |
| 900 | |
| 900 | |
| 800 | |
| 800 | |
| 800 | |
| 800 | |
| 800 | |
| 700 | |
| 700 | |
| 700 | |
| 700 | |
| 700 | |
| 700 | |
| 600 | |
| 600 | |
| 600 | |
| 600 | |
| 500 | |
| 500 | |
| 500 | |
| 500 | |
| 400 | |
| 400 | |
| 400 | |
| 400 | |
| 300 | |
| 300 | |
| 300 | |
| 300 | |
| 300 | |
| 200 | |
| 200 | |
| 200 | |
| 100 | |
| 90 | |
| 60 |
Helps you carry out your project through a logical thinking process
Provide possible solutions and technical information using TRIZ tools for your specific technical problem
Supports: Flowchart, UML, Mindmap, Gantt Chart, ERD, Process Flow, DFD, Org Chart, Venn, Pie, Bar, Wireframe, Blueprint. Presentation: PowerPoint, PPT, Slides, Keynote, Pitch Deck, Templates, Design, Slideshow. Summarize & Visualize Data For: Code Documentation, Projects, Web & Business
Explores the number 5's significance in culture and math.
Explains and visualizes concepts with flowcharts, mindmaps and sequence diagrams.
🎯 INFOGRAPHICS & VISUALIZATION 💾 DIAGRAMS, CHARTS + ANALYSIS 📊 For CODE: Database, UX, ERD, PlantUML! For Business & Data Analysis: Flowchart, Timeline & more!