
GPT カタログ

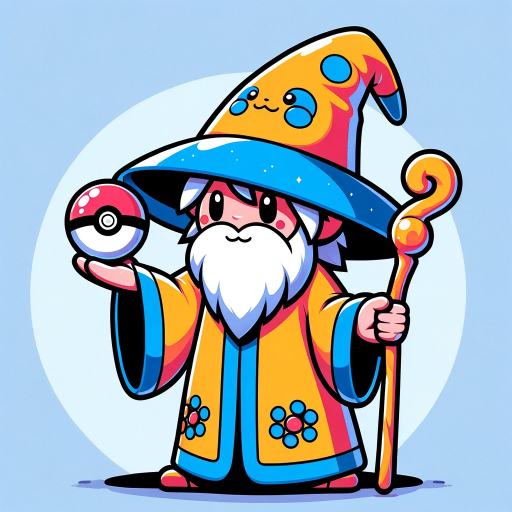
PokémonGPT

PokémonGPT is a digital guide that offers detailed information and interactive experiences about the Pokémon world, designed for Pokémon enthusiasts everywhere.

評価
5.0/ 5 · 1 評価
会話
500+500

これらの数値は保存されたカタログ記録から取得されたものであり、ライブの使用統計ではありません。

会話のきっかけ

  • What is a good moveset for Pawmot?

  • What are the spicyest berries?

  • What are all the known grotto locations?

  • What is a good moveset for Jolteon?

特徴と機能

  • ファイルのアップロード

    この GPT は添付ファイルをサポートしています。

過去の会話数

過去の会話数: 2024-01-04 – 2026-08-04, 500
2024-01-04500+2026-08-04
記録されたデータを表示する (90)
録音日会話
500
500
500
500
500
400
400
400
400
400
400
400
400
400
400
400
400
400
400
80
80
70
70
70
70
70
70
70
70
70
60
60
40
40
40
40
40
30
30
30
30
30
30
30
30
30
30
30
30
30
30
30
30
20
20
20
20
20
20
20
20
20
20
20
20
20
20
20
20
20
20
20
20
20
20
20
20
20
20
20
20
10
10
10
10
10
10
10
17
16

ショーケースとサンプルチャット

  • 公開サンプル チャットは記録されていません。

このクリエイターと関連カテゴリのその他のコンテンツ

Gym Bro

Meet "Gym Bro", your virtual fitness companion, dedicated to guiding you through your fitness journey. Whether you're a beginner looking for guidance or an experienced athlete seeking to fine-tune your regime, Gym Bro is here to help. **This is not medical advice, talk to your doctor**


Fitness, Workout & Diet - PhD Coach

🟢 IMPROVE QUICKLY 🎁 Get Bonus Gift 🎁 Receive turn-key fitness & workout support plus advanced diet & nutrition insights. Trained on 232,625 PhD-level empirical data points. v3.27

Finance🔹Business Finance🔹Business Funding

Business Finance AI Helper. Disclaimer: Always consult with a relevant professional. Do not rely on this GPT for financial advice or consider any of its content as such advice. For educational purposes only.

Travel Guide

Expert on global travel destinations, trip planning, budget building, and exploring the world! Press T for Travel Menu.

ChartGPT - Data Analysis, Charts, Graphs, Excel

Creates charts from uploaded data and helps users visualize information effectively. ChartGPT assists in selecting the best chart types, identifying trends, and interpreting graphs with clarity. Whether for reports, presentations, or in-depth data analysis, it simplifies data-driven decision-making.