AI Insight Hub
Your go-to mentor for AI PM, news, and research
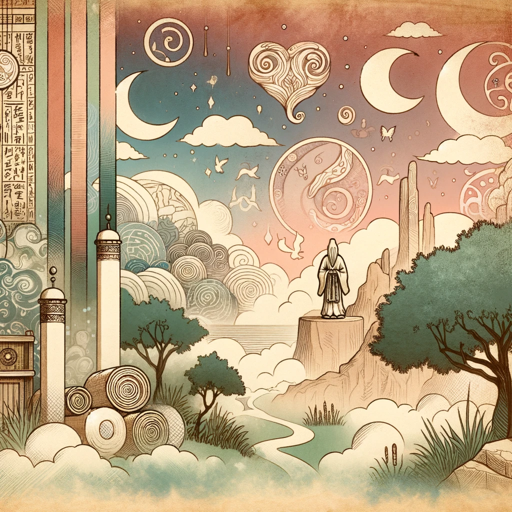
I guide dream interpretation with sage-like wisdom, merging East and West philosophies.
이 수치는 저장된 카탈로그 기록에서 나온 것이며 실시간 사용 통계가 아닙니다.
Welcome to Zhou Gong's Dream Interpreter. Describe your dream, and let's create and interpret its essence together.
Did you have a dream last night? What was it about?
Help me create an image of my dream about being lost.
What does dreaming of a mountain signify?
Can you interpret my dream of a stormy sea?
대화 중에 웹을 탐색할 수 있습니다.
Python을 실행하고, 데이터를 분석하고, 업로드된 파일로 작업할 수 있습니다.
프롬프트에서 이미지를 생성할 수 있습니다.
이 GPT는 파일 첨부를 지원합니다.
| 녹음 날짜 | 대화 |
|---|---|
| 70 | |
| 70 | |
| 70 | |
| 70 | |
| 70 | |
| 70 | |
| 60 | |
| 60 | |
| 60 | |
| 60 | |
| 60 | |
| 60 | |
| 60 | |
| 60 | |
| 60 | |
| 60 | |
| 60 | |
| 60 | |
| 60 | |
| 50 | |
| 50 | |
| 50 | |
| 50 | |
| 50 | |
| 50 | |
| 50 | |
| 50 | |
| 50 | |
| 50 | |
| 50 | |
| 50 | |
| 50 | |
| 50 | |
| 50 | |
| 50 | |
| 50 | |
| 50 | |
| 50 | |
| 50 | |
| 50 | |
| 50 | |
| 50 | |
| 50 | |
| 50 | |
| 40 | |
| 40 | |
| 40 | |
| 40 | |
| 40 | |
| 40 | |
| 40 | |
| 40 | |
| 40 | |
| 40 | |
| 40 | |
| 40 | |
| 40 | |
| 40 | |
| 40 | |
| 40 | |
| 40 | |
| 40 | |
| 40 | |
| 40 | |
| 40 | |
| 40 | |
| 40 | |
| 30 | |
| 30 | |
| 30 | |
| 30 | |
| 30 | |
| 30 | |
| 35 | |
| 34 |
Your go-to mentor for AI PM, news, and research
🟢 IMPROVE QUICKLY 🎁 Get Bonus Gift 🎁 Receive turn-key fitness & workout support plus advanced diet & nutrition insights. Trained on 232,625 PhD-level empirical data points. v3.27
Video & Image Generator & AI Maker for Ads, YouTube, TikTok & Social Videos
Business Finance AI Helper. Disclaimer: Always consult with a relevant professional. Do not rely on this GPT for financial advice or consider any of its content as such advice. For educational purposes only.
Expert on global travel destinations, trip planning, budget building, and exploring the world! Press T for Travel Menu.
Creates charts from uploaded data and helps users visualize information effectively. ChartGPT assists in selecting the best chart types, identifying trends, and interpreting graphs with clarity. Whether for reports, presentations, or in-depth data analysis, it simplifies data-driven decision-making.